专题实验(分段函数的图像)
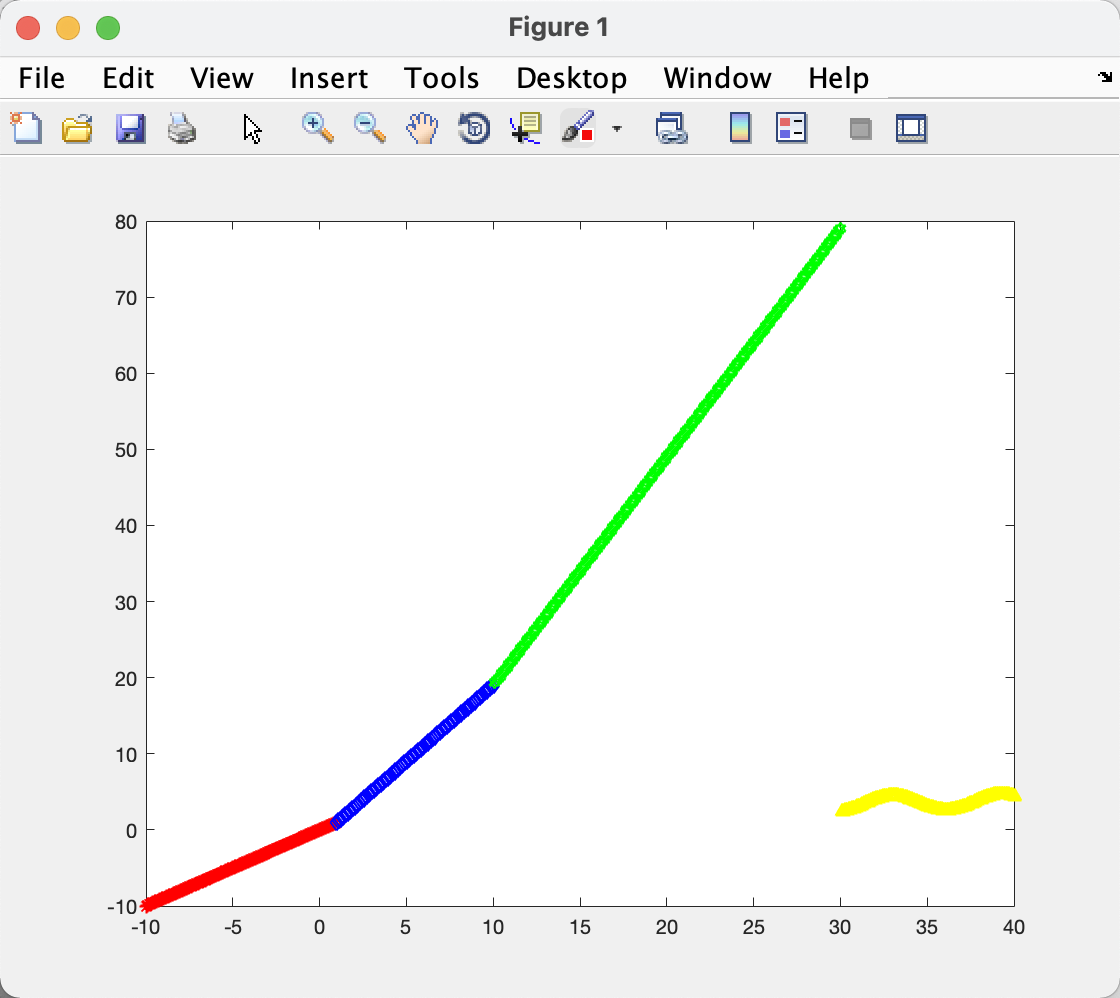
- 请画出以下分段函数在[-10,40]上的图像,每个分段用不同的颜色、线型来描述.
1 | x = -10:0.1:40; |
运行结果
- 选做题:针对1中的函数f编写函数文件,使得可以直接对矩阵或者数组进行运算,进而快速实现画图.
TestFunc.m
1 | function y = TestFunc(x) |
专题实验(二维极坐标画图)
从第2次实验附件中至少挑选2个图像进行绘图。
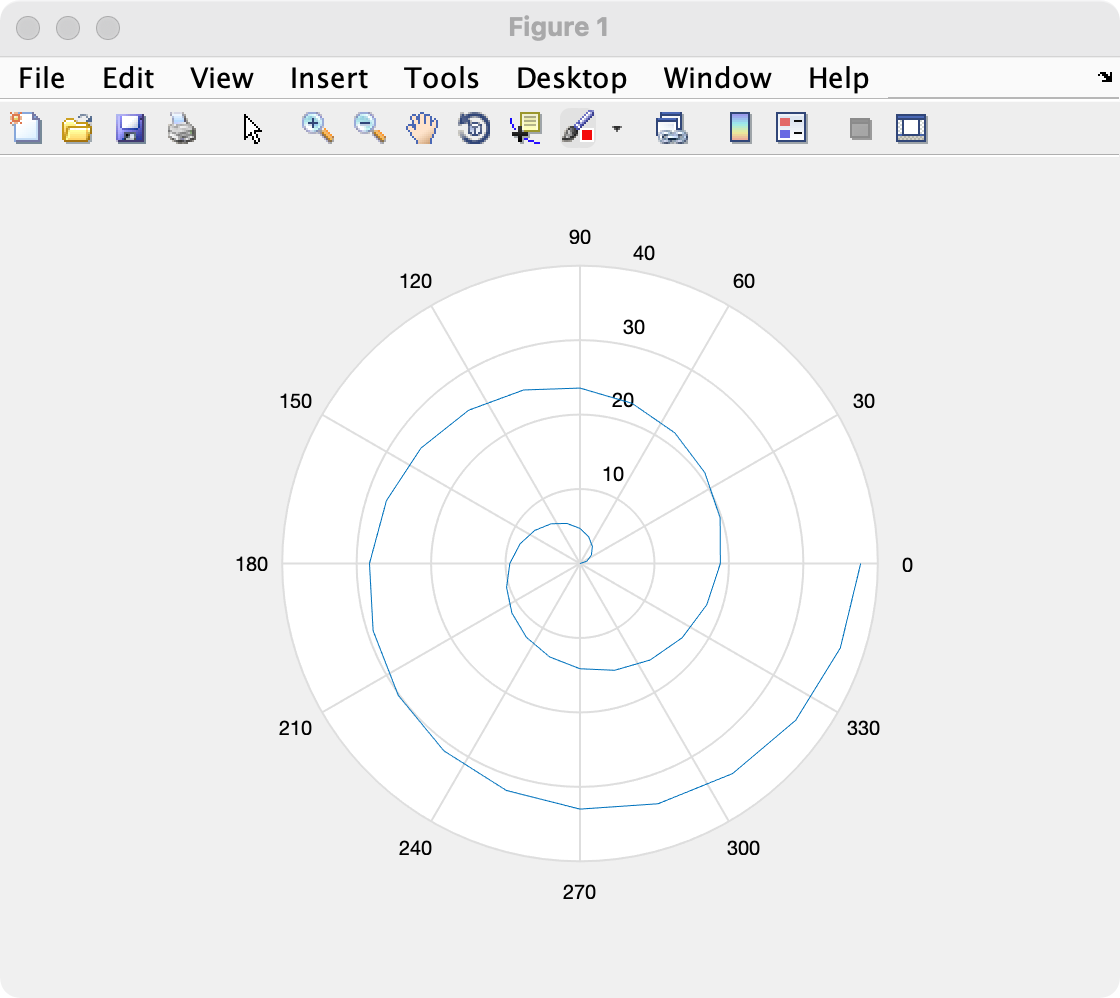
- Archimedes螺线
1 | theta = 0:pi / 10:4 * pi; |
运行结果
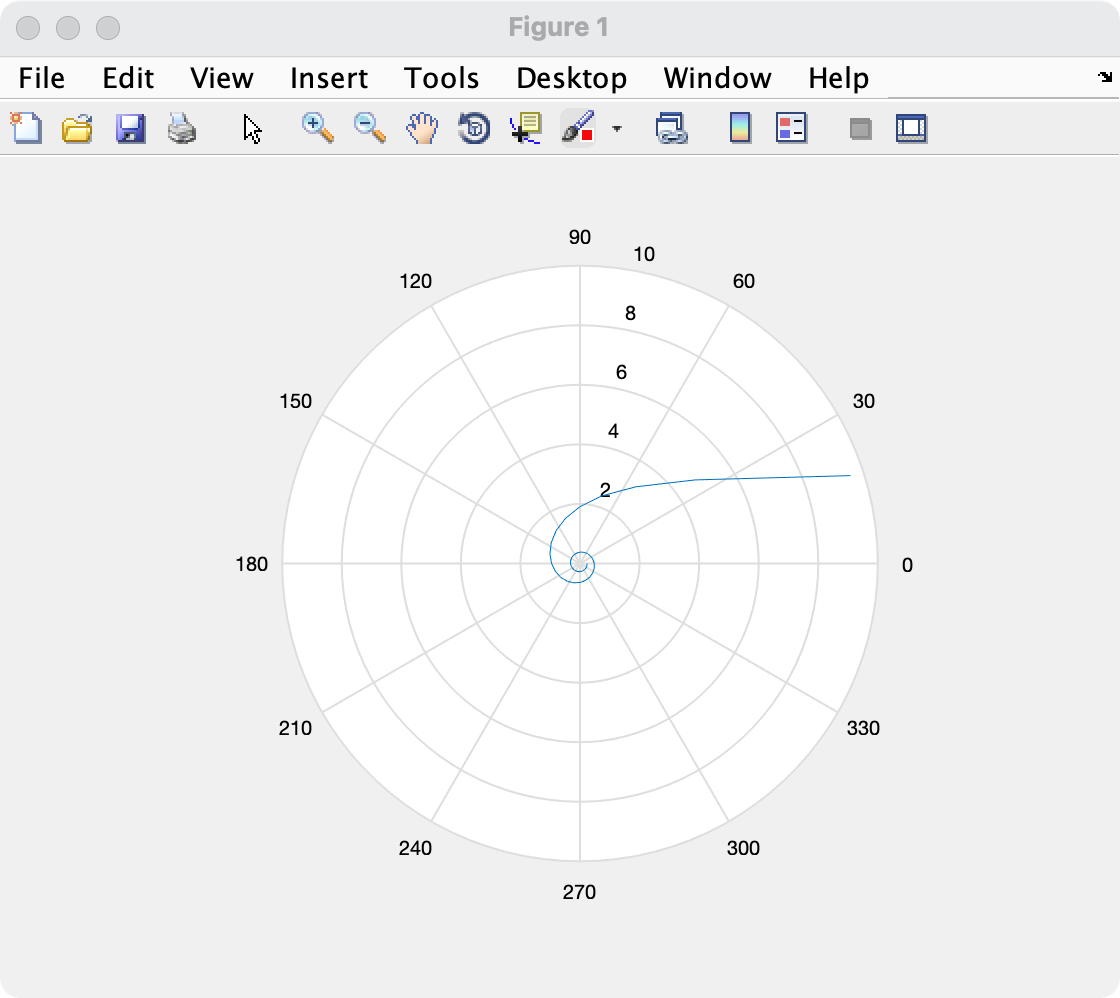
- 双曲螺线
1 | theta = 0:pi / 10:4 * pi; |
运行结果