Matlab实验2-1
Matlab图形操作实验
第4讲例题:4-1,4-2,4-5,4-6,4-7
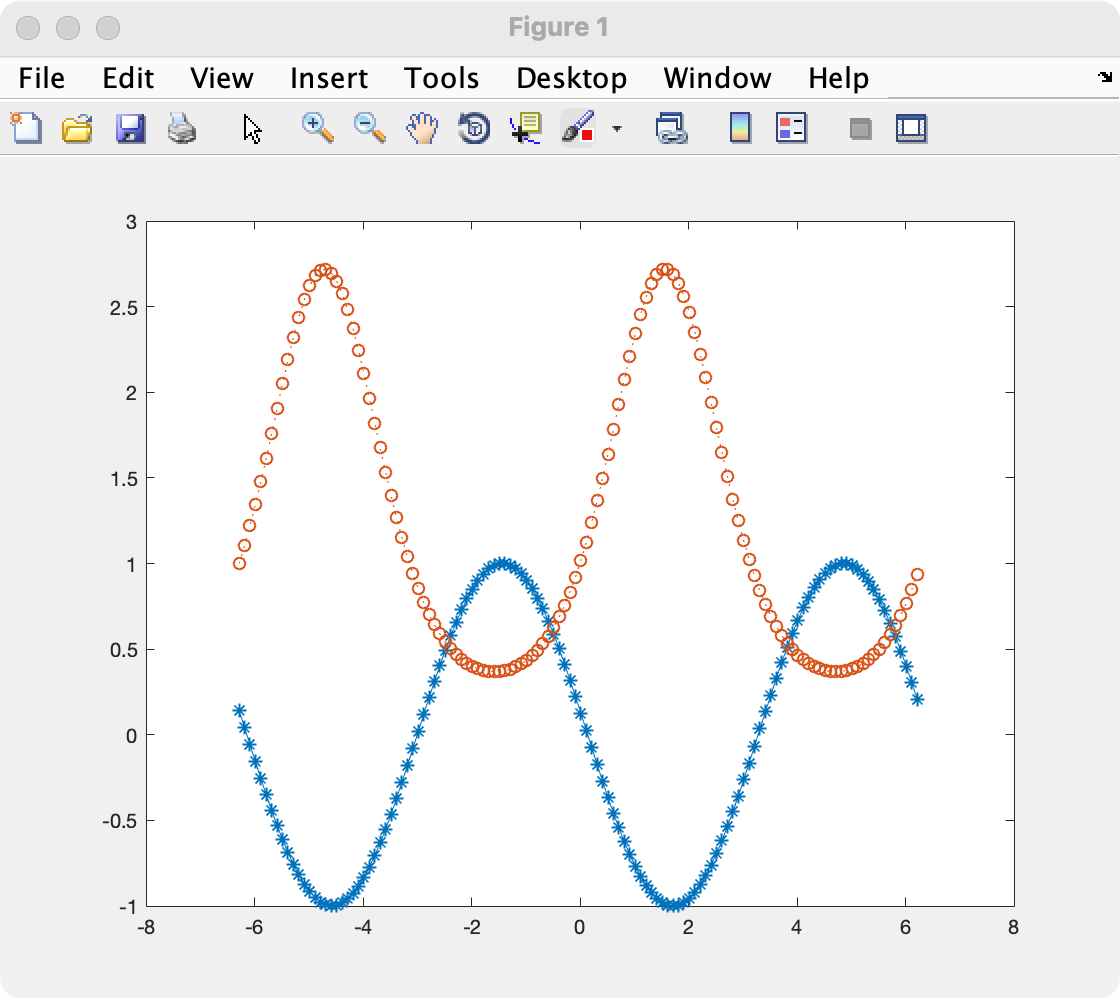
4-1:画和的图像.
1 | x = -2 * pi:0.1:2 * pi; |
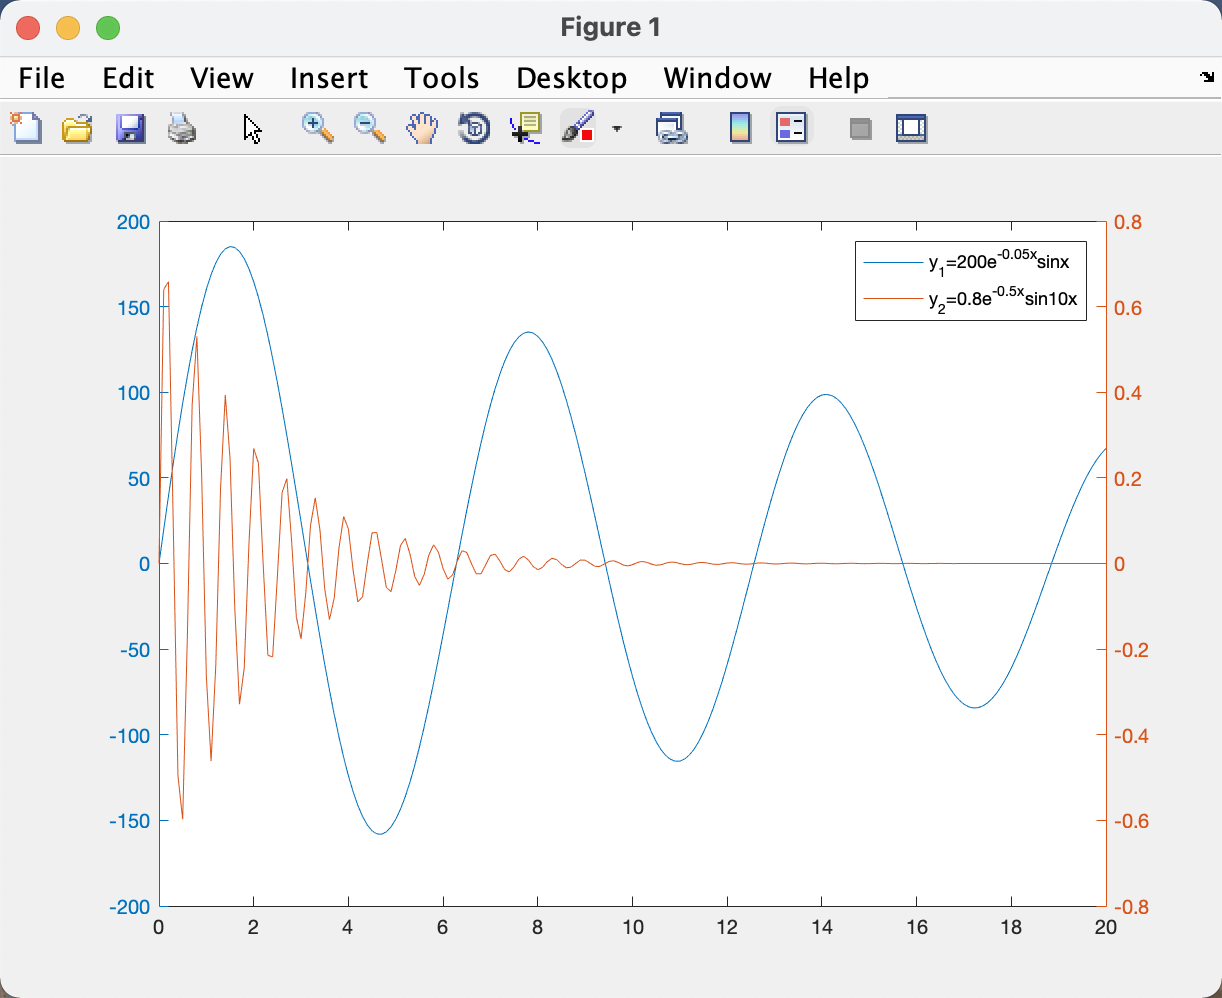
4-2:用不同标度在同一坐标绘制曲线和
1 | x = 0:0.1:20; |
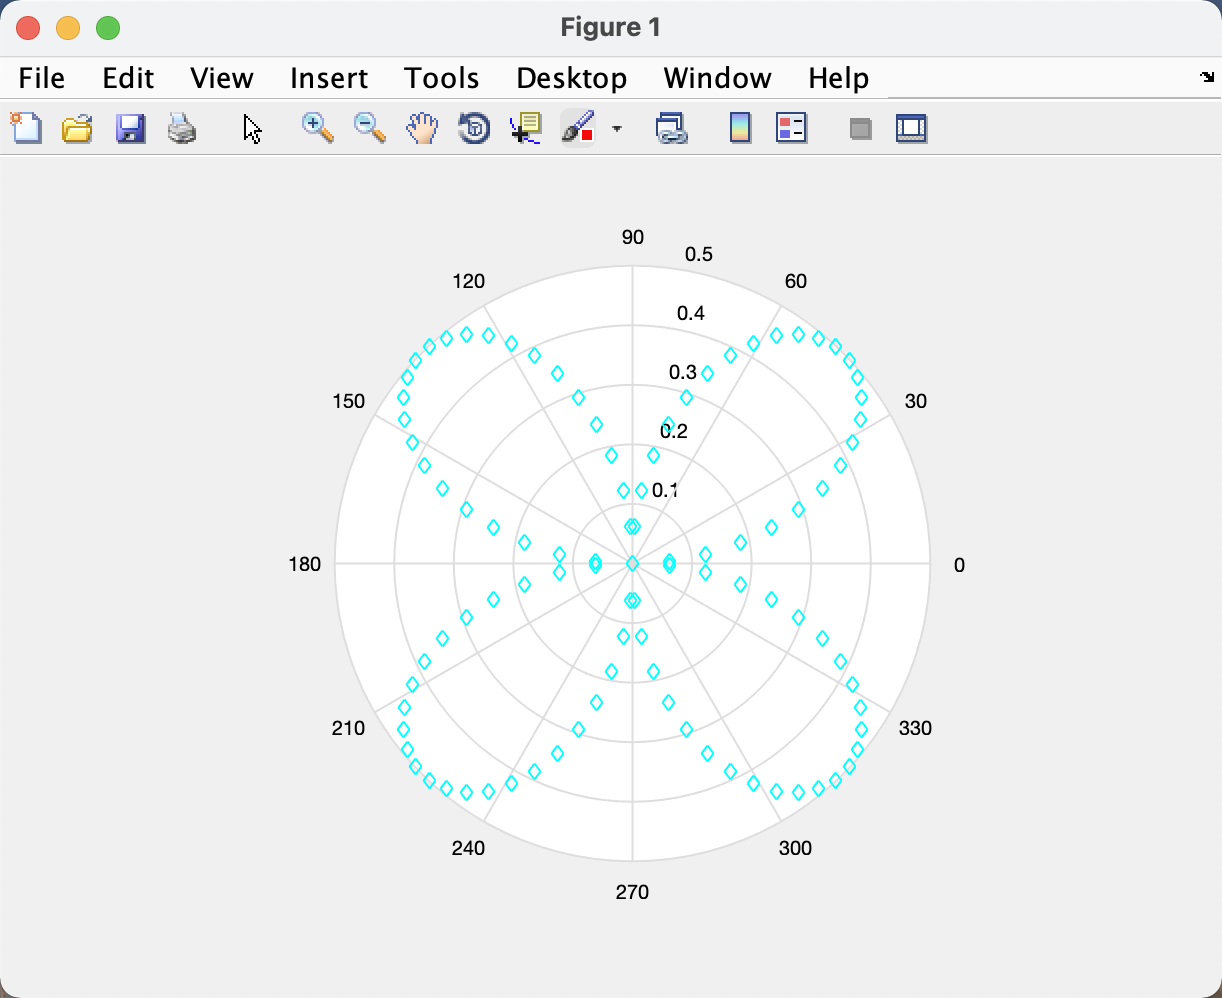
4-5:绘制的极坐标图.
1 | t = 0:pi / 50:2 * pi; |
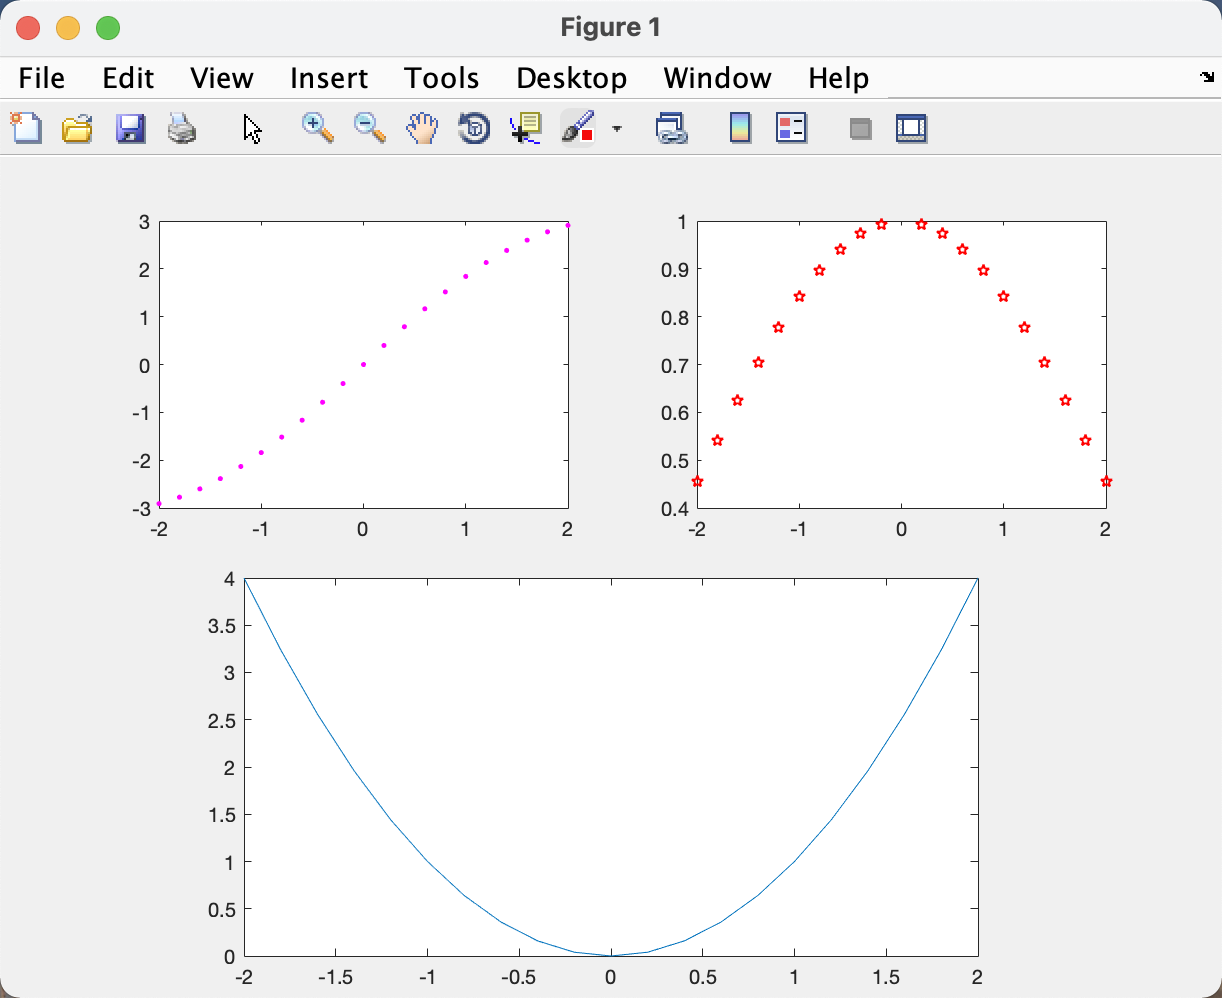
4-6:subplot划分画图区域
1 | %将一个绘图窗口分割成m*n个子区域,并按行从左至右依次编号.p表示第p个绘图子区域. |
4-7:legend 添加图例
1 | x = 0:0.2:2 * pi; |
